
It should be difficult for a roller derby team to score points. So why does it often seem so easy for them to be scored instead?
Derby scoring has seemingly been getting easier and easier over the last several years, with point totals climbing higher and higher. This year’s rules updates appear to have addressed this trend, sure. But even taking games played in 2014, it is still not abnormal for many of them to end with a combined total score of 300, 400, 500, 600 (!), or even more than 700 (!!!) points.

Whether point totals of such magnitude were reached in a close game or a blowout, if it is possible for two teams to together score that often in a 60-minute game, any individual pass for a point, let alone the non-scoring initial passes, must be relatively easy to accomplish.
If it were really that difficult to get points, there wouldn’t be so many of them scored in the first place!
Very high-scoring games still happen quite a lot in the WFTDA and MRDA, especially during mismatches. Scoreboard-spinners can also show up in other derby variants, like in USARS, MADE, or the RDCL.
However, games where the scoreboard hits perilously high totals are less frequent in non-WFTDA forms of roller derby, and of a lesser magnitude when they do happen. This is in part because scoring points is appreciably harder to do, on the average, in these versions of the game.
As a result, these games can often be much more competitive.
Over the last year, examples of just how dramatic the differences in scoring rates between the different styles of roller derby have started to surface. A taste of this difference comes by way of Penn-Jersey Roller Derby, the long-standing co-ed flat and banked track league from Philadelphia.
The PJRD men’s team, the Hooligans, has recently become members of the MRDA. To achieve this, it began playing under WFTDA rules for the first time in its nearly decade-long history, having played by MADE rules and its forebears during that time.
Adopting WFTDA rules, however, has not changed the Penn-Jersey philosophy on roller derby. It has played MADE since the inception of that rule set, and continues to do so; has started playing RDCL on its banked track last year, entering its ladies team into the last two Battle on the Bank tournaments; and has expressed interested in trying USARS next season.
That open, bi-traxual, poly-setual nature has opened up interesting opportunities for their would-be opponents. Namely, the chance for the same teams, with the same rosters, to play MADE- and WFTDA-rules games in the same weekend.
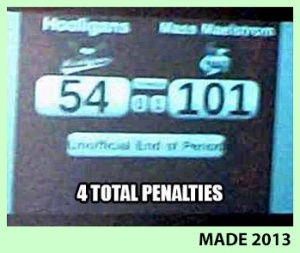
The very first WFTDA-rules game the Hooligans ever played was earlier this year against Mass Maelstrom, at the time ranked #4 in the MRDA. That is a hell of an opponent to have for an initiation test, and it comes as no surprise that the differences between the two teams showed up on the scoreboard and penalty sheets.

This was a pedestrian game for the likes of the Massachusetts men, who had no trouble lighting up the scoreboard against a comparatively weak opponent.
However, something interesting happened when these same two teams took to the banked track the day before to play a regulation MADE-rules game. Scoring in big bunches suddenly became much more difficult for the Maelstrom—about six times more difficult—despite clearly being the superior team.
In both of these 60-minute games, one team was playing by a new rule set for the first time. You might suspect this would contribute to extremely high points totals or an severe blowout in both cases. Yet that does not appear to be the case here.
After the Hooligans had picked up a few more games of experience under WFTDA rules, they repeated the weekend rule set double a few months later. This time, against an MRDA team that was closer to their level, the Carolina Wreckingballs.
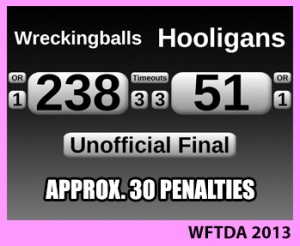
This was still a blowout by WFTDA standards, but one nowhere near the level of the Hooligans’ first go at it.
As it turns out, there was also a blowout when the Balls took their first shot at a different way to play the night before. However, it was the kind of lopsided result more expected in a sport like basketball or football, one where points are never easy to come by even when strong team is playing against a comparatively weak one.

The Wreckingballs won the MRDA game easily, since they were much more in tune with playing by WFTDA rules. The Hooligans won the MADE game for likely the same reason, just with MADE rules.
The winner of each contest is not of concern in this comparison, however. What is, is the overall difficulty of scoring points between the different versions of roller derby.
These games had the same teams, the same rosters, the same 60:00 of play. But not the same level of competition. Taking these four games at face value, one style of roller derby appears to be much more competitive than the other.
What could be causing this difference?
Aside from the banked track—never mind that MADE is dual-surface and plays nearly identically on flat track—the only plausible explanation for this massive change in scoring scale and the much more competitive games they wrought are the different rules in play.
If you generally compare MADE games to WFTDA games, the difference in scoring rates will fall within the 2x~4x range that these two example games did.
In fact, if you compare play among the three major alternative derby rule sets to that commonly found in the WFTDA and MRDA, the numbers show that WFTDA teams, including the elite ones, have had things very easy in comparison.
How this can be and why this matters is a critical insight that roller derby needs to understand as it thinks about what it needs to accomplish to sustain itself, in the short-term and for whatever next step is coming up next in the growth of the sport.
As will be demonstrated, how competitive roller derby can potentially be has less to do with how talented or how equally matched two teams are than you may think.
When you consider what it actually means for a contest to be “competitive,” then widen the focus to look at all games—among the elite, between the average, and with newbies; in the close games, the slight mismatches, and the big blowouts—there is a much more prevailing factor at work.
To discover what this factor is, a point first needs to be made about scoring rates in different roller derby rule sets.
Points of Reference
This analysis will compare score data of games played in different roller derby variations, and the game strategies behind the numbers which might help explain them. In doing so, we can find out how rules differences affect how competitive jams and games will generally be, independent of the skill level or skill gap of teams playing each other.
Four rule sets will be going under the microscope: WFTDA, USARS, MADE, and RDCL.
All data referenced here is from tournaments played in the 2013 roller derby rules season. Old data is being used because it is currently the only year where parallel data exists in the four rules environments. Besides ensuring an equal comparison, this will be useful to see how far along everyone has been in developing their respective rule sets as of the end of last year.
However, the ultimate purpose of the following data analysis the thought process that drives it more than the numbers that are produced by it. The conclusion reached will introduce a concept that transcends rule sets or annual rules revisions.
Once this concept and its corresponding data has been derived, we can use it as a universal point of reference that will help set up the second page of this analysis, where we start talking about the Xs and Os differences between the styles of roller derby that might help explain the numbers.
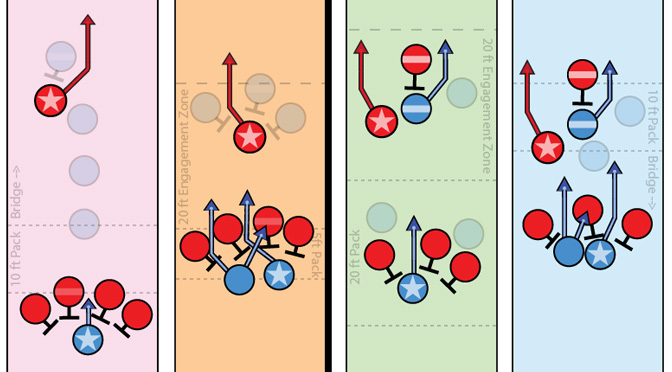
Data and diagrams from different rules variations will be juggled from now on, so note the coloring system in use across the website to avoid confusion. Any data table figure, track diagram, or rules text shaded in pink will always refer to some version of WFTDA rules, as noted. USARS is in blue. MADE is in green. RDCL is in orange. If it needs to be differentiated from the WFTDA, MRDA data will be called out in red.
The source tournaments from which this data comes from are as follows:
WFTDA – 2013 Division 1 Playoffs and Champs (80 games, 40 teams, women, flat)
RDCL – Battle on the Bank VI (12 games, 9 teams, women, banked)
USARS – 2013 Regionals and Nationals (38 games, 17 teams, men and women, flat)
MADE – 2013 Derby Ink Invitational (15 games, 11 teams, men and women, banked)
There are different amounts of game data for each set of rules, and each tournament was played under different conditions. This will not affect the analysis significantly, however. All of these events had a really wide variety of teams taking part, from the really great to the relatively bad. The proportion of huge mismatches to equal match-ups was also roughly the same.
All told, the overall range we are working with is similar across all game environments. We can see this in our first chart comparing the final score differentials in the four tournaments played under the four rule sets.
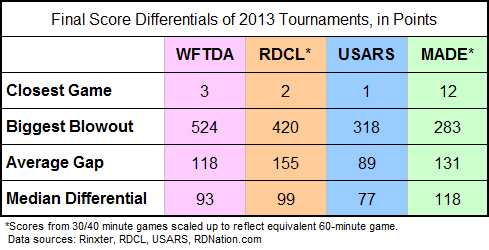
Close games can be very close in any rule set. Blowouts can be very large in any rule set. (Some more than others.) It makes no difference that these games were played under different rules or on different surfaces, played among a lot of teams or very few. No matter what kind of game someone went to see last year, there was better-or-worse than 50% chance that they would would seen a triple-digit blowout.
However, this analysis is not particularly interested in how close or far apart the final score between two teams may ultimately be. What we’re after is a measurement of easy or how hard it is to score points, regardless of the game result.
To help find this out, we can look at the total number of points scored, both teams combined, averaged across all games within the four 2013 tournament data sets.
The logic behind this is that if fewer points are available for teams to compete for in 60 minutes of play, the fight to earn a single point will necessarily be much harder. Lower supply leads to higher demand, and higher demand leads to harder competition to obtain the limited supply.
With this next chart, we can begin to see the differences in how much supply was available in 2013.
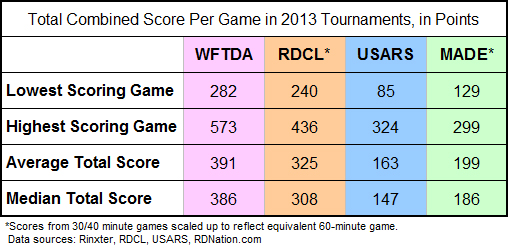
Unsurprisingly, the four highest-scoring games referenced here all ended in point-differential blowouts of the magnitude cited in the first chart.1 On the opposite end of the scale, the lowest-scoring games in the RDCL, USARS, and MADE ended up being in dispute until the final jam.
The lowest-scoring 2013 WFTDA game, a 128-point playoff blowout (Angel City 205, New Hampshire 77) was the odd one out. However, the second lowest WFTDA game total, 283 points, was indeed a last-jam thriller: Rocky Mountain 150, Windy City 133.
It kind of makes sense that a lower-scoring game environment will generally be more competitive than a higher-scoring one. If it is hard to score points, teams of similar skill would be unlikely to score/give up a lot of points very quickly. It would also make it at least somewhat more difficult for a good team to grossly blowout a lesser opponent.
Then again, the two WFTDA bouts just cited show you can have a low-scoring blowout and a low-scoring close game. All the same, you could have a high-scoring close game next to a high-scoring blowout.
Still, the general relationship between lower scoring games and more competitive ones is a concept that merits further investigation.
To see if it holds water, we need to factor out what teams that are playing against each other, thereby disregarding relative ability levels or final score differences. Without these variables, we can directly observe the constant the “default” level of competitiveness, as measured in an average game of roller derby between two average teams.
A thought experiment will let us discover this constant.
Hypothetically Ideal Roller Derby
Imagine an “ideal” game of roller derby where players and teams are of ideally equal abilities.
One team’s defensive prowess would be equaled by the other team’s offensive mastery, and vice versa. (That is to say, equal offense and equal defense should cancel each other out.) The same strategies would be available to all, at all times. Penalties would be relatively low, or at least equal between the teams.
This is the ideal that many in derby today see as the ultimate. Eventually, everyone will improve to the point where there is very little between teams no matter who is playing. Mismatches and blowouts would be rare among top or near-ranked opponents, and it’s likely that a major chunk of games among them would be highly competitive.
What might one of these games look like?

If equal teams had an equal chance of scoring points or stopping points (offense and defense at the same time and all that) it would undoubtedly be a very close game from start to finish. It’s not a stretch to imagine that every single point would be highly contested2 and hardly fought for, on every single jam.
In a roller derby contest for points, both teams should have the same chance to score a point as they do to defend one. Whatever one team does on offense, the other team must be given an equivalent chance to counter with some sort of defense. And vice versa.
In a literal equal match-up of teams, both would have offensive opportunities to find ways to get their jammers clear of the initial pass, no matter what their opponent tried defensively. Both should have a fairly equal chance of getting their scoring players out on the same scoring pass on every jam, therefore.
At the highest level of idealism between two equal teams, both teams would get their jammer out of the pack at the same time. Every jam would almost have to end with a 1-0 (or 0-0!) score due to the constantly close initial passes and neck-and-neck jammer races that would inevitably follow.
To simplify, let’s agree that two realistically equal teams would ideally have a very difficult time getting in more than one scoring pass at a time. This would necessarily limit jam scores to 1-0, 1-1, 2-0, 2-1, 3-0, 3-1, 4-0, 4-1, or other combinations of contested points scoring.
Assuming a low penalty count would result in the majority of jams happening in full packs, and that penalties are ideally balanced3, a greater number of full-pack, lower-scoring jams should account for the vast majority of scoring. Enough, that scoring spikes in lopsided penalty-heavy jams would be rare and not adversely scoring in the long run.
From this thought experiment, we can make a reasonable deduction.
When roller derby is played at an ideal level of competitiveness, the average rate of scoring on a per-jam basis must average out to a number around four points or less, the number of total points expected to be scored in a jam that is equally contested between both teams.
It doesn’t matter which team scores these points, or even if both teams score on a jam. If the number of total combined points scored divided by the number of jams played calculates out to a number less than 4.00 points per jam (PPJ), every average jam must have been competitive on a fundamental scale.
This is our ideal: As far as competitive balance goes, you can’t do much better when both teams have a real, direct shot to score points on every play.
To put this points per jam “ideal” idea to the test, we can use real roller derby game data from potentially less-than-ideal gameplay.
A Note on Jam Scores and Jam Length
The PPJ measurement we are about to examine is different than the typical jammer scoring stats you may be used to. The PPJ we will be talking about here does not directly reflect what one player or one team scores in a jam or game, meaning it is different than the points per jam stat you might see on Rinxter.4
Instead, the PPJ we’ll be using here is literal: It is how many points are scored in a jam, both teams combined. That is, a jam ending with a 4-0 score and a jam ending with a 2-2 score are equivalent, because four players were lapped for points in each of those jams. Hence, 4.00 PPJ.
This is a universal concept that can go across different rulesets, even though each rule set has different jam lengths.5 PPJ treats them all as “one jam,” because competitive jams usually don’t go the distance. Hit-it-and-quit-it jams will cut short a jam well before its natural conclusion, generally rendering jam length irrelevant.
If not called off early, however, two different situations may play out. One, you could get a lengthy jam if it is difficult for both teams to battle through on the initial and finally get around to score one hard-earned pass, like a 4-0. Two, you might see both jammers circulating and both teams scoring multiple passes, perhaps leading to something like a 14-10 jam score.
As far as points differential is concerned, these are both the same: A 4-point jam win. But again, we don’t care about jam score differentials. From the PPJ perspective, 4-0 (4.00 PPJ) and 14-10 (24.00 PPJ) are very different. Instead, it is the 14-10 and 24-0 (24.00 PPJ) jam scores that are equal.
This difference is important. Harboring the potential for lopsided, high-scoring jams (such as a 24-0) can overpower the smaller score differentials of many other competitive jams in such a way where the small jam wins (including the 14-10 jams) become less relevant to the final game result.
Higher average PPJ values therefore make any single point less important overall across the entire competitive spectrum of games played. If a large chunk of points can easily be scored in any given jam, there is less of a chance that smaller, harder victories will be meaningful in the long run. When there are fewer jams in a game, creating less opportunity to cobble together enough minor points to counter the effect of a few big scores, then only the big scores really matter.
The opposite is true for lower PPJs. If it is extremely likely that two teams are equally contesting points, no matter their skill level or relative skill difference, minor points are the only points generally available and every single one of them becomes important. Many more of the smaller, harder victories will be meaningful, because they all carry equal weight against the final outcome of a game.
This is what PPJ measures: The value of a single point within a roller derby game environment.
Something more valuable is something worth working harder for—supply and demand, remember. We can use PPJ as a proxy to measure the difficulty a team must overcome, on offense and defense, in order to earn that single point over their opponent’s attempt to do the same thing at the same time.
The Universal Constant: Points Per Jam
In examining the average per-jam scoring rates across all games played at the 2013 championship/final tournaments in each of the four rules environments, we can see how close to the hypothetically ideal scoring rate each of them are. From this we can figure out which yielded the most difficult and most competitive fight for roller derby points, when averaged out across all games played.
Remember, 4.00 PPJ is our ideal figure. It is the target number that indicates every point during a scoring pass is being contested by both teams, making every point more difficult for a team to score and that much more valuable to secure.
In looking at the real-world data, however, such an ideal may not be hypothetical after all.

There’s a simple way to picture what these numbers mean in the context of actual gameplay, using the 9.18 PPJ WFTDA average as an example.
We know the effect penalties, power jams, passive offense, and an unproven ranking system had on WFTDA playoff games in 2013. With PPJ, we can both quantify and describe just how significant the effect was.
Penalty-heavy, multi-pass jams overwhelmed WFTDA tournament games so much, it was as if was there was nothing that the best teams in the world could to do prevent getting a grand slam—and more!—scored on them in every single jam of every single game at Championships last year. Every single jam! And there were over 500 of them at Champs last year!
The other forms of roller derby have a much more interesting story to tell. Despite not having as many good teams or as deep as a field as the WFTDA, the numbers suggest, paradoxically, that all non-WFTDA forms of the game last year were significantly more competitive on a per-jam basis.
USARS and MADE games had average scoring rates at a level under 4.00 points per jam, indicating they are already working in an ideally competitive environment. When averaged out, every pass was contested across all tournament games. Big scoring chances were hard to come by, suggesting no positive point differentials came easily.
RDCL scoring last year was 6.02 PPJ, about two points higher than the target number. However, an average in this range must mean that several RDCL games clocked in under the ideal scoring rate, balancing out those that were well above it, showing that there were a significant number of ideally competitive jams played there as well.
Don’t forget that all of the tournaments this data is coming from had median final score differentials of 100 points, give or take. Each of the four events had big mismatches and a lot of bad blowouts.
However, this does not necessarily mean these mismatches and blowouts led to hopelessly uncompetitive games. On a fundamental level, points were contested similarly to the well-matched, close games.
PPJ explains why.
Look at the non-championship MADE-rules tournament from last year, the Derby Ink Invitational. It had the largest average adjusted score differential of 131 points, showing its games were primarily lopsided blowouts.6 However, its average scoring rate of 3.43 PPJ demonstrates that even if final scores were not competitive, jam scores were. All of the time.
Points were highly contested on every jam. During mismatches, the superior team won those contested points way more often. Even so, the inferior team still got a fair chance to also contest those same points. It didn’t actually score the points, obviously, explaining the blowouts. But at least it had the opportunity on offense and/or defense to limit the damage to one scoring pass against on a majority of jams.
It was always going to lose the war. But by playing in a low PPJ environment, an outmatched team knew it always had a chance to up a fair fight in each little battle.
PPJ averages work best when used with large samples. With enough games to measure, it becomes a strong indicator of how fair the competition for points is, independent of what teams may be playing.
Below is a table of PPJ averages from other breakdowns from the 2013 WFTDA Division 1 tournament season. It shows an interesting pattern.
Focus on sets of games that exclude extreme blowouts7. Or only calculate the extreme closest games, those that finished with the lowest score differentials. Sample divisional games between just the top teams, those that played among each other for a ticket to Championships. Or just look at the two best teams in all of roller derby last year, Gotham and Texas, in their battle for the Hydra.
All of these games had good, well-matched opponents. You might assume that having mostly equal, more-ideally matched teams would lead to lower per-jam scoring rates, when averaged out, since their offensive and defensive abilities would be better at cancelling each other out on any given jam.
But actually…
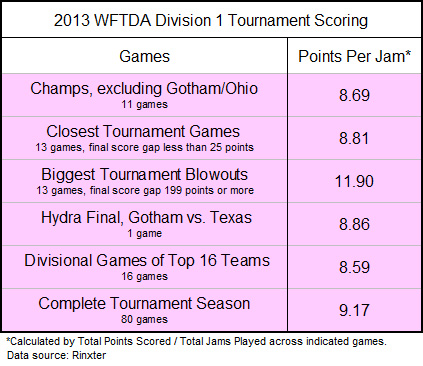
It makes sense that PPJ would be higher and scoring easier during the most extreme mismatches, and that shows in the tournament games that were the most extreme blowouts. Yet the opposite did not apply in the WFTDA last year.
Compared to the others, the values were not significantly lower in the extreme closest games played during the 2013 playoff season. Nor during the most competitive games at 2013 Championships, where converging brackets would be expected to make matchups more equal and scoring more competitive.
In fact, if you take a points per jam average of the whole 80-game 2013 WFTDA D1 tournament season, you get a number that’s exactly the same as the number seen at Championships: Just under 9.2 PPJ.
This is the fascinating thing about the PPJ concept. What cross section of games you look at doesn’t really matter. With enough data, it will always average out to around the same value.
Take a group of good teams playing close games. A set of average teams in typically random bouts. Contrast men’s teams to women’s teams. Take data from in a seeded tournament or a multi-bout event.
It makes no difference. In the end, the PPJ numbers will always be similar.
We can see this is the case with games played during other events in 2013, for which per-jam data is available.
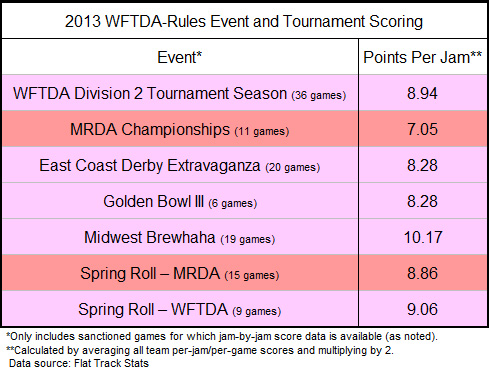
Some events here have lower scoring rates, MRDA Championships 2013 (7.05 PPJ) in particular. But those are balanced with the ones with higher scoring rates, like Midwest Brewhaha (10.17 PPJ).
A high concentration of elite teams playing one another (Golden Bowl III, 8.28 PPJ) does not make jam points any more or less contested than in games among a conglomeration of different teams of various skill levels (ECDX, 8.28 PPJ).
Packing seeded teams very close together (D2 tournament, 8.94 PPJ) did not produce a significantly different scoring rate than having a broader spectrum of ranked opponents facing each other (D1 tournament, 9.17 PPJ).
Comparing men’s play and women’s play, the scoring rates aren’t significantly different when everything averages out over several games and events. Spring Roll 2013 is a clear example of this, with just a two-tenths point average difference between the genders.
The previously cited PPJ averages from the USARS (3.70 PPJ) and MADE (3.43) tournaments, which combined games from parallel competitions among men and women, produces a similar equality when the genders are separated. Less than 1.00 PPJ difference for both, in fact, although a scant number of men’s games means the separated figures may not be completely reliable.
To address the issue of small sample size and attempt to arrive at a definitive proof of the PPJ concept, let’s look at the the biggest set of data possible.
Thanks to Flat Track Stats and its meticulous attention to recording game statistics, jam-by-jam data is available for over 700 WFTDA and MRDA games played between February 2013 and January 2014.
We’re talking WFTDA sanctioned, MRDA sanctioned, and unsanctioned; close bouts, typical games, and blowouts; between elite teams, average teams, and bad teams; played in single games, multi-bout weekends, or seeded tournaments. All of it.
Get this: The calculated average scoring rate for all cited games in the FTS database is 8.92 points per jam.
For all intents and purposes, this is identical to the 9.17 PPJ scoring rate seen during the whole of the 2013 WFTDA playoffs and the 9.18 PPJ average at Champs 2013.
Despite the vastly different circumstances they happened under, WFTDA-style games played last year had a 9.00 PPJ scoring rate in common. On the track, this translates to an uncontested grand slam and a contested full scoring pass in every single jam of every single WFTDA and MRDA game across all of 2013.
No matter how good or equal teams were, this many points were expected to be scored every time the start whistle blows. Over 30,000 jams. Nine points scored in every single one, when averaged out.
Like, woah.

Who is playing a game or how close it is completely irrelevant to the absolute measurement of point-by-point competitiveness that is points per jam.
The reason for this spooky commonality between so many different games? It is because of the only other thing all these games have in common:
The rules the games were played by.
A direct correlation between the overall “default” level of competition (for points) and the rule set in use is the only possible conclusion that can be reached here. It couldn’t be a skill or strategy problem, because the scoring rate is the same between teams of low skill or high skill. It’s not a ranking or seeding problem, because moderate mismatches and relatively close games also produced roughly similar PPJ figures.
It has got to be WFTDA rules that last year caused so many WFTDA games to have many jams that were like mini-blowouts, even in games between well-matched teams.
To say nothing of the teams that were not so well-matched.
– – – – – – – – –
With this revelation, we can start making some deductions about the other derby rule sets in this analysis.
First, we can posit that RDCL rules are the reason why an average RDCL game saw around 6 points per jam during Battle on the Bank last year across all its games. Boiling this down to one example average jam, this would be like a bad (“bad”) team always having enough opportunity on offense to free their jammer just after the lead jammer gets a grand slam. Sometimes, later than that. But often well before.
We can also say that USARS and MADE rules are the reason why every single scoring pass, on the average, was equally contested between all the teams in their respective 2013 tournaments. Even if you include into the average games where jam scores and final scores are terribly lopsided, you still wind up with an overall game environment where every team has a real chance to score points and a real chance to prevent them from being scored.

Further, we can theorize that in the RDCL, MADE, and USARS, a majority of common, non-tournament games played under their 2013 rule sets featured much more competitive derby on every jam. Their tournament PPJ numbers strongly suggest this.
The scoring rate sticks to the same number whether it happens inside or outside of tournament play, as Flat Track Stats WFTDA data has proven. There’s no reason to suspect it would not do the same for other forms of roller derby.
Which leads back to the idea of “competitive” roller derby.
In a roller derby contest, teams are competing for points. To make this contest for points fair, you must guarantee that teams have an equal chance to get them every time the start whistle blows.8
Ranking systems or seeded tournament formats cannot always install this guarantee of fairness. How equal two similarly-ranked teams is still a big variable at this stage, so just putting them together and hoping a competitive game will result is an unreliable strategy, especially outside of tournament play.
The only foolproof way make sure teams and players can always compete for roller derby points and have an equal opportunity to play offense and defense at the same time, is to guarantee so through game rules.
The rule book in use is the only thing that is consistent across all contests. Just like how basketball’s shot clock rules guarantees both teams a chance to score—and forces them to play offense and defense, whether they want to or not—there are roller derby rules that do the same.
Of course, the difference with roller derby is that all five players on both teams are made to play offense and defense simultaneously. Certain rules and their derived gameplay elements are necessary to make sure roller derby is always being played—whether a team wants it to be played or not.
As we will next explore, there are multiple ways rules can achieve this.