
The 2015 WFTDA playoff season has been over for a few months now, but there is still a lot to look back on. Rose City’s biblical win over Gotham in the final, on ESPN3 no less, will not soon be forgotten.
But did you know there were four other Division 1 games, and eight more Division 2 games, that were just as good (or better!) from start to finish? That’s one of the many insights waiting to be discovered in the data we’ve collected during the playoffs.
We’ve been tracking stats from the WFTDA playoffs for a few years now. Since 2011, we’ve been looking at penalty trends in the postseason. The expansion of the WFTDA’s public stats keeping over the years has also allowed us to track scoring trends on a broader scale. Improved production values on the WFTDA.tv broadcasts has given us the ability to gather rich data on official reviews, too, which is something you’re not going to see anywhere else.
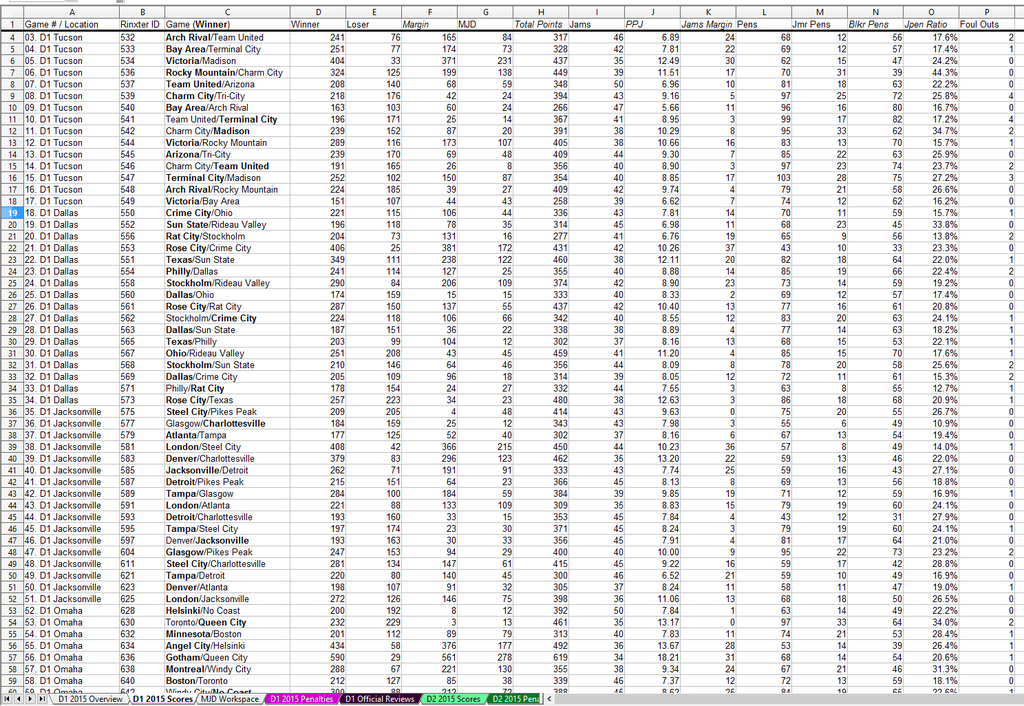
We take all that good stuff from D1 and D2, sprinkle in a handful of games from MRDA Championships, add a dash of statistical wizardry, then throw it all together in a master spreadsheet to see what there is to see. Here’s a small sample of what that looks like:
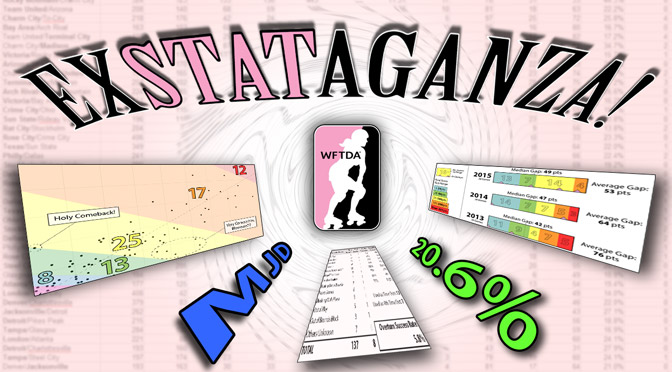
For 2015, we’ve collected more information than ever. It took us a good bit of time to crunch the numbers and make all the pretty graphs and charts to go with it, but the wait is over. It’s time for the two-page stats extravaganza we call the Roller Derby Notes WFTDA 2015 Playoffs Exstataganza!
Scoring, Part 1: How Close Were the Games?
One of the easy things to track to gauge year-to-year improvement of the quality of play during the playoffs is if games are getting more competitive. More close games is something everyone wants to see. Blowouts still happen in today’s WFTDA, but if they’re happening less frequently and aren’t as severe, that’s good for the progress of high-end competition.
First, let’s look at Division 2. When the WFTDA created the 20-team bracket in 2013, it was an instant success. Packing that many closely-ranked teams into a smaller tournament promised there would be a lot of close games, and they have consistently delivered. Almost one out of every three games over the years have had teams close enough at the end where one jam could have been the difference.
More importantly, they’ve shown improvement with fewer not-close games, as you can see in our fabulous closeness-of-games chart.
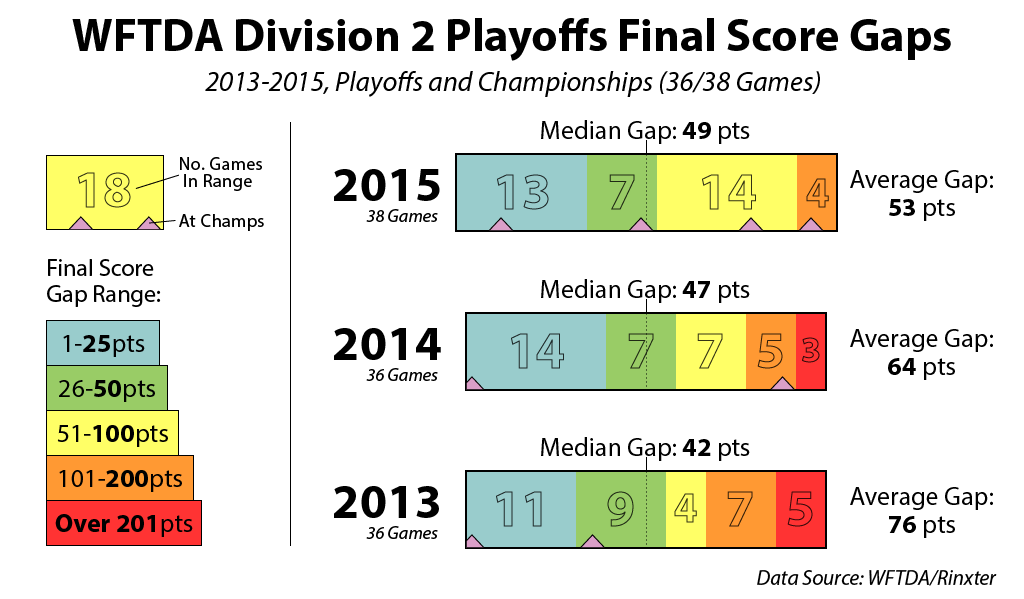
Look at how the distribution is changing, especially on the right side of the scale. In 2013, 12 of the 36 games were blowouts, including five severe (200+ point) blowouts. This past year there were four 100+ point blowouts, and that’s it.
The reduction of blowouts has helped to significantly push down the score gap average of all games played in Division 2. The median difference is going up slightly, but still at a point where the majority of games played are finishing with competitive final scores. (For the WFTDA, we define that as any game that finishes within 50 points.)
Going into 2016, we should expect Division 2 to continue to have a lot of butt-clenching finishes. We might even see every game finish within 100 points, which would be a significant milestone.
Things look different in Division 1. With more games and a wider skill gap between teams, blowouts are going to happen frequently. The level of play necessary to be one of the top 40 teams should be improving every year, though. One would think that the frequency and severity of bad games should lessen with that improvement.
A graphical overview of the Division 1 games played over the last three years makes it tricky to say if that’s actually happening on the bottom end of the spectrum. It’s clear as day that things are getting better at the top, though.
The pink markers in the charts here each represent a game from Championships, and where they fall on the spectrum of closeness relative to the other games from that season. These markers show a definite trend.
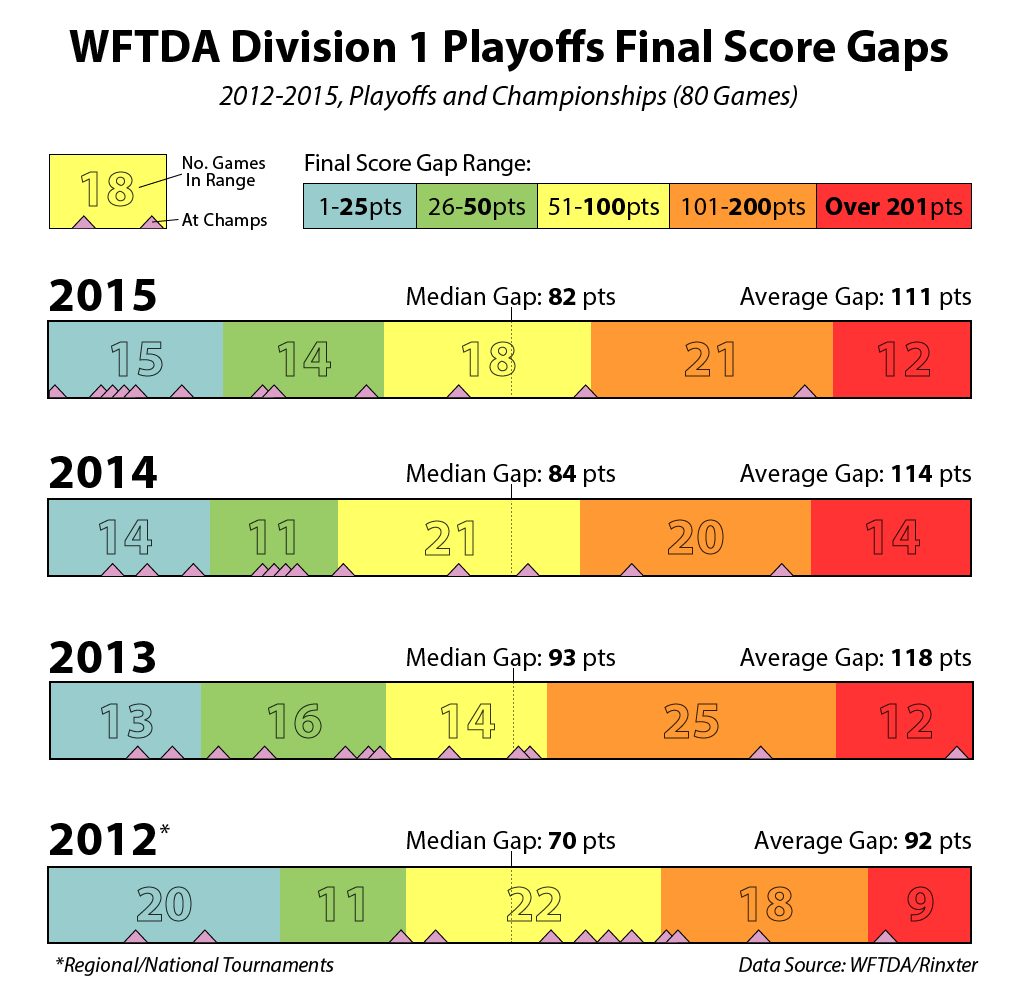
The bottom row of the chart, 2012, is the last year of the regional and national playoff format that the WFTDA was using before switching to its divisional format and the new ranking system that came with it.
As you can see, there were many more close games and far fewer blowouts back then. To be fair, some of that might have had to do with the concentration of near-ranked teams in each region. But those great regional weekends came at the cost of the national tournament, where good games were few and far between.
When the WFTDA switched to divisions, one of its goals was to make sure its best games happened during WFTDA Championships, its showcase event. It took a few years, but it’s definitely happening now.
The median score difference of the 12 games at Nationals 2012 was 90 points. At the first Championship tournament in 2013, it dropped to 50 points. After holding steady at 47 points in 2014, the median score gap at Champs 2015 plummeted to a mere 27 points. Five of the closest eight games in the D1 playoffs happened a few months ago in Minnesota, actually.
However, it’s not hard to argue that the overall 40-team Division 1 tournament is still too big. For many games, the result is a foregone conclusion within minutes and have little to no value to fans. There have been gains—the average gap and median gap are both creeping lower—but they pale in comparison to what’s been happening at Championships and in Division 2.
If nothing changes with the playoff format, it’s going to take a very long time for the bottom teams get close enough to the top teams to see the games between them have something more on the line than an arbitrary amount of ranking points. Not that we would ever expect teams in the bottom 16 to beat the teams in the top 8 any time soon. But maybe the teams at the bottom, and their supporters, deserve more than having to be involved in 300-, 400-, or 500-point blowouts during the playoffs.
As for the teams at the top? It’s great that they’re finally starting to play in a highly-competitive tournament, one worthy of being called the WFTDA Championships.
Introducing Median Jam Differential
A game that ends with a big score gap doesn’t automatically mean the two teams involved weren’t playing competitive derby at some point beyond the first few minutes. Sometimes, a game that looks average on the final scoreboard was better than what the points difference would indicate.
A particular game early in the Division 1 season got us thinking about a way to quantify just how competitive some of these uncompetitive games actually were.
In the D1 playoff opener at Tucson, Arizona took on Madison in an 8/9 seed matchup. A lot of people were expecting this game to be close, but in the end Madison won 221-171, a final score difference of 50 points.
Now, 50 points in the WFTDA isn’t that big of a score gap. If you only had the final score to try and judge the competitiveness of the game, you might conclude it was borderline good, at best.
However, those that saw the game will know that it was much, much more than that.
After 36 of 42 total jams, the score difference was 20 points or less. The teams were no more than 6 points apart after 24 jams. Three points or less separated the teams after 17 jams. There were lead changes or ties after 14 of the jams.
That is a ridiculously close game!
By one measurement, Arizona vs. Madison was just about the closest game of the entire Division 1 playoff season … up until the dying minutes. When Madison went on a very lopsided 74-18 run to pull away for good, their 50-point win camouflaged a titanic battle.
Our quest to identify and recognize other games like this has led us to develop a roller derby statistic called the Median Jam Differential, or MJD for short.
Like the final score gap, MJD is gauge of how close a game is based on what the scoreboard says. However, the final score only tells you what the game was like at the end. MJD will let us find games that were very close (or not very close) for the whole 60 minutes, something the final score cannot reliably tell us.
To calculate the MJD for a game, we record the score difference between each team after each jam, disregarding who is leading or if the lead changes. After stringing out these individual values, we simply take the median of the set.
We would expect the MJD of any given game to be half of the final score difference. In a typical game, we can assume a team that has won by X points had more or less consistently gapped their opponent through the first and second halves of play. This should mean the score difference in half the jams played (regardless of when they happened, so it’s not always the gap at halftime), and therefore the median of all jams played, should be approximately ½X points.1
A game with a final score difference of 50 points, like Arizona/Madison, has an expected MJD of 25 points. An MJD value significantly lower than that (or just low in general) would signal the game was more competitive than final score indicates.
And it was! The MJD of the Arizona/Madison game was a mere 6 points, the lowest of all 80 games played in Division 1 last fall.
On the other side of the coin, an MJD that is much higher than expected means the game wasn’t as close as it looked. A Division 2 contest with the same 50-point final score gap, Sacred City vs. Chicago Outfit, had an MJD of 47 points.
The reason why it’s so high? Sacred went on a 102-18 run over 10 jams in the first half and would lead by as much as 81 points in the second half. A 46-4 spurt by the Outfit in two late jams would help make the final score more respectable, but MJD reveals that the game was actually a dominating performance by Sacred City, who was never really threatened after the first 10 minutes.
Two games with similar final scores now look very different when you factor in median jam differential. With MJD, we can add a new dimension to the closeness-of-games charts shown previously and use it to find out just how many games were better—or worse—than they appear to be on the surface.
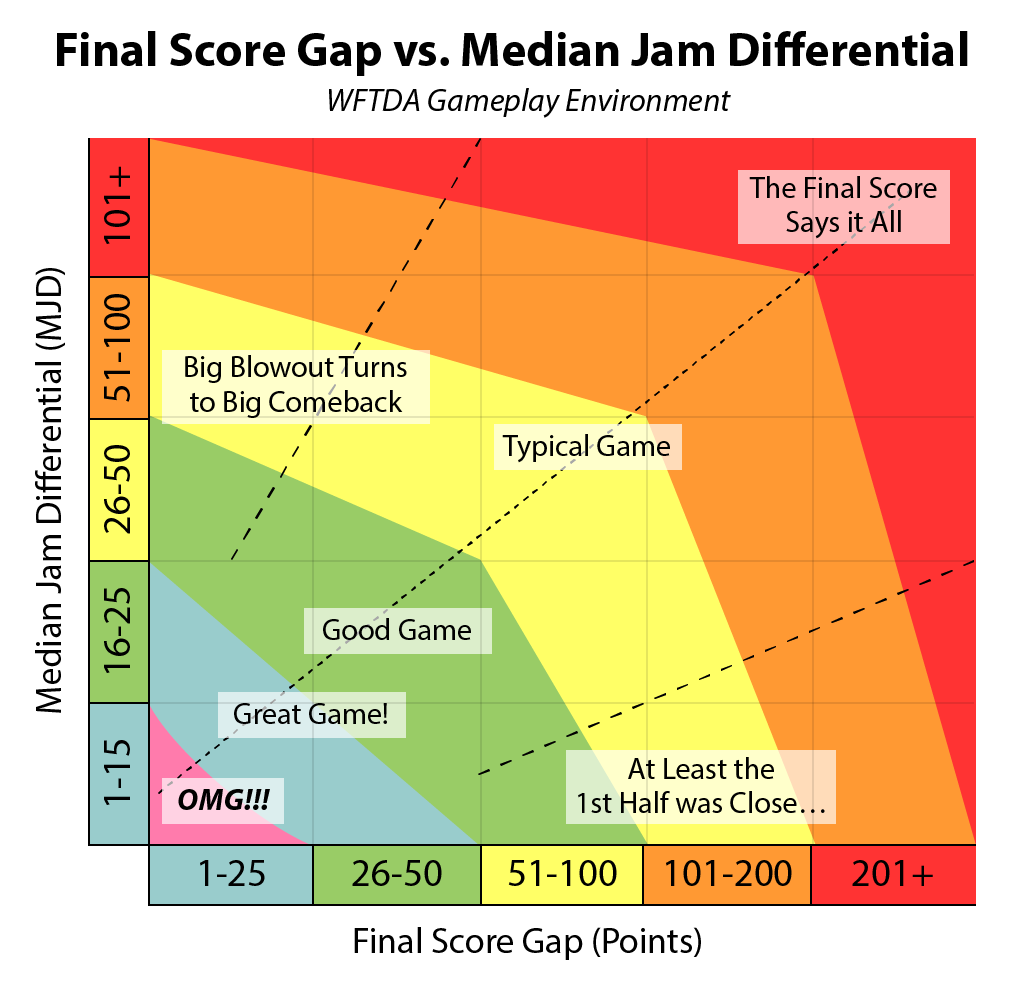
After we ran the numbers, we realized it was possible to identify games in ways that we couldn’t do with just the final score alone. A “good game” could mean a close finish, but it could also describe a lopsided game that was very close throughout the first half. The final score difference or the MJD will be able to identify each of these types of games, because they were good in different ways.
But what if they’re good in both ways? That’s the pink bit in the bottom corner of the above chart. It represents the best of the best in roller derby, games that are not only super-close at the end, but also super-close after each any every jam leading up to the finish.
These are games that are so good, they can only be described with the highly technical term, OMG!!!
When charting out all the games from the Division 1 and Division 2 playoffs, we found a handful of these instant classics. We also found some very interesting things on the extreme ends of the scale, which is where the MJD statistic begins to show its true colors.
Scoring, Part 2: How Close Were the Games…Really?
Let’s revisit how close games were in Division 2 in 2015, this time adding the MJD axis to the chart.
The dashed diagonal line represents the best fit for all the data points. It fits pretty much bang-on with the expected 2:1 ratio between final score gap and median jam difference.2 The colored sections have a larger number that indicates how many games of that type happened during the D2 playoff season.3 Note that a handful of games are off the chart, though not in a good way; some blowouts were so bad, we had to trim them out to make sure the competitive games were easily visible.
For the games we do see here, some things stand out.

The first should be pretty easy to spot. That massive cluster of dots in the pink zone indicates there were a hell of a lot of super-crazy OMG!!! games in Division 2 last season.
The craziest of them all might have been Columbia/Treasure Valley from Cleveland. It had a final score of 132-129, a 4-point difference, and an MJD of only 6 points. MJDs this low suggest the teams had a very hard time pulling away from one another for the majority of the game. That indeed happened here, with Columbia and Treasure Valley staying within 11 points or less of each other for 23 of the last 24 jams of the game. Absurd!
There were seven other games in Division 2 that were just as tight throughout and just as close at the end. Three more were great games in their own right (the blue zone), though not as close as those from the OMG!!! group. Another 11 were solidly good (green zone), though some of them weren’t your typical competitive contests.
The red dots in the chart represent games that have strayed a bit from the expected relationship between final score gap and median jam differential. These outliers generally describe competitive games with a big point-scoring streak resulting in a large and sustained lead during the game.
Sometimes, these games can turn a potential blowout into a significant comeback. In Detroit, Bear City took the lead from Emerald City after 4 jams and kept their foot on the floor, leading by as much as 67 points in the second half. Emerald City made a decent run in the last third of the game, however, but ran out of time and fell to Bear City by 20 points. A close final score, but it came after a relatively uncompetitive game with an MJD of 32 points.
Other times, a game with a very close first half ends up as an easy victory for one of the teams. Though Treasure Valley got off to a shaky start and only led for two jams against Brandywine in Cleveland, they stayed within striking distance for most of the game, only behind one or two scoring passes. But with 10 jams to go, Brandywine took charge and cruised to a 59 point victory. This one didn’t have the closest final score, but it was a very competitive game throughout with an MJD of just 10 points.
When the final score gap and the MJD disagree with each other this much, you get atypical games. Perhaps due to the overall consistency in the Division 2 tournament, there were about an equal number of each type of outliers on either extreme.
However, when we add the MJD axis to the larger pool and wider skill gap of teams in Division 1, things get very interesting.
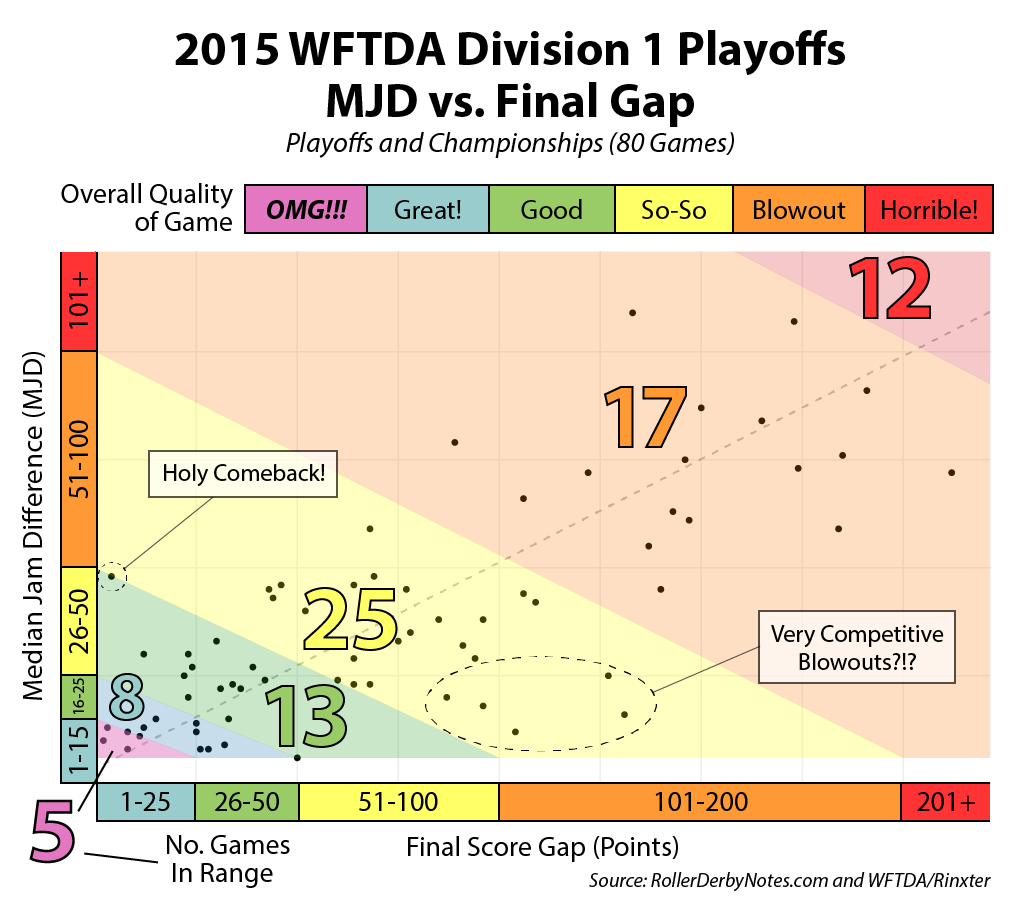
There were at least seven Division 1 games where the final score gap was not only hiding the type of game that was played, it was completely lying about it!
We already talked about one of these games, the Arizona/Madison contest (final gap, 50 points; MJD, 6 points). That one is tame compared to the cluster of five circled in the bottom-middle of the chart. All were close throughout the first half, only for one of the teams to completely destroy their opponent in the second half.
The most extreme case is the Rat City/Stockholm game from Dallas. Stockholm held on to a slim 62-54 lead at the end of the first period, but then Rat City went absolutely mental in the second, outscoring Stockholm 150-11.
This tale of two halves led to 131-point final score gap and 16-point MJD, suggesting the game was, strangely, both very bad (the second half blowout) and quite good (the super-tight first half). Combined, the complete 60 minutes is one of many so-so WFTDA games (the yellow zone), though one that’s better than the final score would indicate.
Together, these five games had an average score difference of 8 points at halftime and a 108-point average final score gap.4 It’s not unusual for a team to fall apart at the seams, take a lot of penalties, and give up boatloads of points, but it’s a bit strange for it to happen so suddenly and so markedly in that many games after each of them had very competitive first periods.
What about the other extreme? There are a few more Division 1 games in the region of the above-the-line red dots from the Division 2 chart. But one of them is way up there!
That would be the Steel City/Pikes Peak game from Jacksonville. It’s so far to the left because it was the third-closest game of the playoffs. If you’ll remember, this was the game that had the insane comeback bid by Pikes Peak. In the last 8 jams of the game, PPDD went on a frantic 59-0 scoring run, only to come up just 4 points short at the final whistle.
Just for fun, here’s the last jam of the game. A crazy finish, huh?
However, this game is as high as it is on the chart is due to its MJD of 48 points, which is huge for a game that finished this close. Big enough that the game as a whole wasn’t nearly as competitive as the final score suggests it was.
The thing about a team making a big comeback is that it had to fall very far behind to begin with. The crazy finish doesn’t give a pass to the very uncompetitive opening, when Pikes Peak allowed Steel City to bolt to a 78-4 lead after only 11 jams. Steel City stayed that far ahead for most of the game, which could have just as easily ended in a blowout. But because Steel City also fell asleep at the wheel, Pikes Peak was able to return the favor.
This big almost-comeback was made possible by scoring many points in a short period of time. Due to the nature of penalties and streaky scoring in the WFTDA, this is a possibility in any game. A lot of people like the fact that mistakes on the part of one team allow the other team a chance to rapidly close a gap, making 30-, 40-, or even 50-point WFTDA games much closer than they appear.
Here’s the interesting thing: It was the only comeback of its kind to happen in the combined 118-game 2015 WFTDA Division 1 and Division 2 playoff season.
Compare it to the group of five or six Division 1 games, and maybe a seventh or eighth if you add in a similar Division 2 games, that ended with a streak of uncompetitive jams and a blowout victory, despite the teams being engaged in a super-competitive game the majority of the time.
Even though large runs are possible in any game of WFTDA roller derby, as are comebacks, our data suggests that that they will take a good game between competitive teams and turn it into an uncompetitive one way more often than they will help the underdog recover from a game-long deficit.5
This makes you wonder what benefit there is to competition in the WFTDA when a lot points can be scored relatively quickly and easily in any given game. It’s not as bad as it used to be — remember one-minute power jams? — but there is still a lot of volatility in scoring.
At least going by what happened in 2015, this volatility is making a lot of games appear better than the final score indicates. But to put that another way, it’s potentially making a lot of games between good teams not as good as they could be.
If increasing the level and equality of competition in the playoffs is a goal of the WFTDA, there’s definitely room for improvement in this area, especially if the WFTDA continues to insist on pitting teams with large skill gaps against one another in the brackets.