
Big news, flat-track followers: The WFTDA has released updated league standings and with it the seedings and brackets for the 2013 WFTDA playoffs. This has always been a major event on the roller derby calendar, but this year brings significant changes to the formula for determining who plays where.
The four-region system used in the past few years has been abolished in favor of one “global” region, one where all member leagues are lumped into the same system. The system itself has also gone under a major change, foregoing polled rankings for a math-derived rank based on strength of opponent and point spread of games. There is also the addition of a lower-tier divisional playoff, to give a few more teams exposure to a national tournament experience.
In this two-part “Bracketology” examination of the tournaments, we’ll take a look at who is (and isn’t) in the tournament, how the seeds and playoff sites match up, the methodology behind why the WFTDA dispersed teams the way that they did…and why a lot of trouble might have been avoided with a few simple changes.
Because now that the ranking sheets have hit the fans, it’s clear that there are few issues—a few big issues, actually—that need to be addressed for future playoff editions. One might even surmise that the WFTDA could have avoided some of these issues ahead of time with some forward thinking or careful consideration of their options.
But we’ll get to that in Part 2. First, let’s first take a look at the 20 teams in Division 2 competing for a special invite to the WFTDA Championships in November, and an alternate view on how the 2013 playoffs would have went down had they happened under last year’s regional format.
The 2013 WFTDA Division 2 Playoffs
Here are the 20 teams that have accepted invitations to two Division 2 playoff meetings, noted with their tournament seeds and overall WFTDA ranking.

Des Moines, Ia. – August 16-18
WFTDA Tournament Page
Official PDF Bracket
- Sin City (43)
- Brewcity (44)
- Blue Ridge (48)
- DC Rollergirls (49)
- Jet City (52)
- Duke City (53)
- Omaha (57)
- Tallahassee (58)
- Dallas (62)
- Treasure Valley (64)
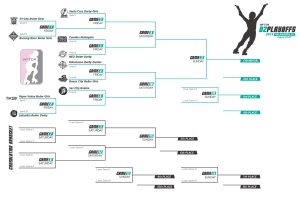
Kalamazoo, Mich. – August 23-25
WFTDA Tournament Page
Official PDF Bracket
- Santa Cruz (42)
- Sac City (45)
- Killamazoo (46)
- Carolina (50)
- NEO Roller Derby (51)
- Queen City (54)
- Paper Valley (55)
- Tri-City (60)
- Burning River (61)
- Suburbia (65)
Readers will note that there are teams in the divisional playoff some spots below the natural ranking cut-off of 60th. This is due to the fact that four teams that would have otherwise qualified for the Division 2 tournament chose not to or were otherwise unable to participate.
Despite temporarily being in the top 40 a few months ago, the Mid-Iowa Rollers (ranked #47 in the WFTDA) have actually not played a game this year. They are going through a league rebuild and were never going to be in playoff picture. Like many teams, their ranking only fluctuated due to significant old games dropping out of the ranking calculation, not through meaningful present-day action.
Fresh out of the Apprentice program as a Division 3 team, Gainesville (59) played in four sanctioned games this year and would otherwise appear to have qualified for playoff inclusion. However, the WFTDA league class system, of which Gainesville is Class C, requires leagues to be Class A or Class B to be playoff-eligible. (Public details on the specifics of the class system are not available, but it appears to be tied to financial capabilities in some way and are independent of league ranking or region.) This would explain why they were not able to participate in the D2 tournament despite ranking-in for it.
Two teams that met the participation requirements and were the best available to fill the bracket, Silicon Valley (56) and Tucson (63), chose not to accept their invitations. This allowed the next teams down, Treasure Valley (64) and Suburbia (65) to go in their stead.
The exact reasons why Silicon Valley and Tucson declined their playoff berths are unclear. However, it’s not difficult to guess a potential part of the reason why.
Below are two maps of the United States. The one on the left pins the ten Division 2 teams going to the Des Moines, Ia. playoff site. The one on the right contains the ten headed for Kalamazoo, Mich. The red lines are the distance each team must to travel to get to their respective tournaments. The purple pins on both maps highlight the two playoff sites for reference. The yellow pins represent Silicon Valley and Tucson, who would have been slotted into the Des Moines and Kalamazoo sites, respectively, had they been able to go.
When it’s broken down visually, you should get a pretty good idea of what’s happening:

Although the two Division 2 sites are mostly centrally located within the country, it’s a friggin’ big country. Many teams, particularly those nearer the Pacific Ocean, have a long, loooooong way to travel on relatively short six-weeks notice. Two California teams that are going to play off, Sac City and Santa Cruz, both are being made to travel a few extra hundred miles over a perfectly good playoff site on the way to one that is even further away from them. Plus, there is a definite cluster of teams near one location, and a long-spoked wagon wheel of itineraries converging on the other.
The question must be asked: Why must it be done this way?
It’s not far-fetched to speculate that SVRG and Tucson might not have been able to comfortably afford to make travel arrangements to participate in such a far-flung tournament. Or at the very least, not have been able to fund-raise enough money to make the relatively large distance in the short amount of time between finding out they were playoff eligible to playing in the playoffs. Especially in the case of Tucson, who already has enough to worry about every year in hosting Dust Devil.
Granted, there’s a pretty sizable incentive to attend. Weight-boosted tournament games can improve their ranking in the long run, and the top two teams in each tournament get to go to Milwaukee and play along side the top teams in the WFTDA on its biggest stage.
But if the financial and logistical costs of reaping these benefits may be too high for some teams to reach, is that a good thing for roller derby at this still-early stage of its growth?
The counter-question is whether or not the increased tournament opportunities outside the WFTDA top 40 and the competition it brings will be worth the added financial burden placed on lower-division teams. If the assumption is that more competitive tournaments (and a better rule set, let’s not ignore) get more people interested in watching, which gets more revenue in from fans, sponsors, and the WFTDA.tv portal to counteract that additional expense to leagues, then the answer to that question may well be yes, probably.
A counter-question to that counter-question is why the WFTDA chose to have fewer playoff sites for its lower division and more for its upper division, which is completely backwards to how sports normally handle the situation. Assuming smaller or less-competitive teams generally have fewer resources than the big, elite teams, more lower-division playoff sites (and fewer high-division sites) would make much more sense. More D2 locations would make it easier to spread them out across the country, thereby putting less of a logistical burden on smaller teams and making their participation, both from the players and the fans that want to travel with them, more realistic in the long run.
In any event, this being the first crack at a Division 2 tournament for the WFTDA, they will (hopefully) learn what works and what doesn’t work, then (hopefully) make any tweaks to the formula (hopefully) next time around.
Because even if this year’s new divisional playoff system isn’t perfect, it’s still an improvement over the regional system they used last year.
…or is it?
– – – – – – – – – – – – – – –
The 2013 WFTDA Division 1 Playoffs, 2012 Regional Edition
Before fully diving into the Division 1 bracket, which will happen in the next Bracketology post, let’s take a gander at what the 2013 divisional playoffs might have looked like had they been contested under the 2009-2012 regional format to see how much of a difference the switch may have made this year.
With the vote-based ranking out of the picture, the current math-based ranking system can instead seed teams into each of the four regions (East, South Central, North Central, West) to get a general idea of what the tournaments would have looked like. From this, we can determine who would have been lucky to get in, who would have been snubbed, who would have likely reached championships, and whether or not the “best” teams in the WFTDA would have ultimately been the ones competing for the Hydra at Championships, as was the reason the WFTDA abandoned the regional format in the first place.
Like in previous years, the top 10 teams from each “region” meeting eligibility requirements (two games against in-region opponents) qualify for regionals.
The forty teams qualifying for the Big 5 this year (last year? thislast year?) are…
“East” Region – Richmond, Va.
- Gotham (1)
- Montreal (8)
- Philly (14)
- London (16)
- Steel City (18)
- Charm City (20)
- Boston (23)
- New Hampshire (37)
- Columbia (41)*
- DC Rollergirls (49)
“South Central” Region – Asheville, N.C.
- Texas (6)
- Atlanta (7)
- Kansas City (21)
- No Coast (22)
- Houston (26)
- Tampa Bay (29)
- Jacksonville (30)
- Nashville (33)
- Oklahoma (34)
- Blue Ridge (48)
“North Central” Region – Fort Wayne, Ind.
- Windy City (10)
- Arch Rival (11)
- Naptown (13)
- Detroit (15)
- Minnesota (17)
- Ohio (24)
- Madison (25)
- Cincinnati (32)
- Bleeding Heartland (35)
- Chicago Outfit (36)
- Toronto (39)
- Grand Raggidy (40)
“West” Region – Salem, Ore.
- Denver (2)
- Bay Area (4)
- Angel City (5)
- Rocky Mountain (9)
- Rat City (12)
- Rose City (19)
- Wasatch (27)
- Sacred City (28)
- Victoria (31)
- Terminal City (38)*
- *Oly (3)
Numbers in parenthesis are the June 2013 WFTDA rankings, the most current as of this post. Teams in blue made their “regional” tournament despite not being ranked in the overall top 40. Teams in red ranked in the top 40, but were not (or may have not been) in the top 10 of their “region” and therefore would have not made it to the playoffs, if this were last year.
Note Oly, who only played one nearby opponent (Jet City) and therefore would not have qualified under last year’s playoff eligibility requirements. (Might Oly have played another opponent to qualify for “regionals” and left all their tournament options open this year? Only they know.) This let Terminal City make it in, despite not being “regionally”-ranked in the west top 10.
Looking at the teams in this way yields some very interesting observations. One that struck me right away as how few teams outside the WFTDA top 40 were inside their respective regional top 10’s. Last year made it seem like a lot of lowly teams displaced a lot of higher-ranked ones, both at the regional level and at Championships, due to different regions having much different skill levels in and around the top cut.
This year, things appear to be moving along the same lines we were beginning to see last year, like how the West is continuing to get top-heavy, how deep the North Central is becoming, and how the divide between Gotham and the other top teams in the East is only growing larger.
The move from the regional system to the divisional system doesn’t change the fact that some areas of the country still have stronger teams than others, however. Check out this list of the WFTDA-rank average of the top ten teams from each of the old regions, in various configurations:
Average WFTDA Rank of Top Ten Regional Teams
- 26.6 – East (no London)
- 25.6 – South Central
- 22.8 – East (w/London)
- 21.8 – North Central
- 17.5 – West (no Oly)
- 14.0 – West (w/Oly)
Even with Gotham persisting as the best team in roller derby, the East doesn’t have the best concentration of top teams; only with the help of a team half a world away does it avoid being in bottom place. (The high saturation of leagues in the northeast almost certainly has something to do with this.) As always, the best teams in the WFTDA are still clumped up on the short side of the Rockies, which is especially the case now that Angel City’s meteoric rise has turned the Power Six into the Power Seven, depending on whether or not Oly decides to come back to the WFTDA.
Which is why it makes sense that the teams in the west would be the most thankful for the switch to the divisional playoff format. As we discussed last year, all the Power Six western playoff teams would have, in all probability, taken half the invites to the 2012 WFTDA Championships had they not taken each other out at Besterns. The carnage would have continued this year had all those teams had been crammed into the same regional tournament.
But this being a hypothetical look at the brackets, we’re going to cram them into the same regional tournament anyway.
Using Flat Track Stats’ Predictor Tool, we can get an idea of which three teams might have advanced out of their respective regions to comprise the 12 teams that would have made up this year’s WFTDA Championships, had the previous regional system still been in place.
Probable 2013 WFTDA Championships Qualifiers, 2012 Regional Format
- East – Gotham (1), Montreal (8), London (16)
- South Central – Texas (6), Atlanta (7), No Coast (22)
- North Central – Windy City (10), Minnesota (17), Ohio (24)
- West – Denver (2), Bay Area (4), Angel City (5)
- Remaining Top 12 – Rocky Mountain (9), Arch Rival (11), Rat City (12), Naptown (13)
Again, teams in blue made it in despite not being one of the 12 “best” teams in the WFTDA. Teams in red were good enough to make it by the numbers, but couldn’t escape regional overcrowding or bad match-ups.
Eight of the top 12 ranked teams would have made it to Championships last year under the regional format. Can we do better with this year’s divisional format?
Let’s see how it compares with the expectation of the actual playoff seeding. The following list is the Flat Track Stats projection (as calculated manually, by me) for the 2013 WFTDA Championships and the four S-curve seeded divisional tournaments as they are right now. What the FTS calculator spits out, divided by region for ease of comparison, is telling.
Probable 2013 WFTDA Championships Qualifiers, 2013 Divisional Format
- East – Gotham (1), Montreal (8), Philly (14), London (16)
- South Central – Texas (6), Atlanta (7)
- North Central – Minnesota (17)
- West – Denver (2), Bay Area (4), Angel City (5), Rocky Mountain (9)*, Rat City (12)
- Remaining Top 12 – Windy City (10)*, Arch Rival (11), Naptown (13)
Note Windy City and Rocky Mountain; the FTS predictor puts a critical game between them as an effective dead-heat, so pick your winner. Also, every playoff model I’ve been running has Arch Rival face Ohio early in the bracket, and Ohio wins the FTS prediction every time. (Sorry, St. Louis!)
Regardless, the projections paint a strange picture. Under last year’s format, four potentially deserving teams would have been unlucky. This year, three deserving teams might get shafted, which is barely an improvement.
But it’s important to realize that in both cases, the teams who started in the top 12 but might not finish there are always the lower seeds. In fact, the same can be said of the regional top 10s; only teams near the edge of the overall top 40 (38, 39, 40) found themselves squeezed out by teams outside of it, in some cases very close (41) to the outside of it.
This is to say that the teams higher up in the ranking, either the top 40 or the top 12, were always a pretty sure bet to make it to the playoffs or to Championships regardless of the tournament format being used.
This is important information. Math-based rankings are good at finding the obvious front-runners or general groups of teams in a large field (say, the for sure top 7 or 8 out of the top-12 ranked teams) but are less reliable when it comes to ordering teams exactly correctly. Math alone also has a hard time finding out which teams are actually better than one another at some arbitrary cut-off point, such as #12 or #40 or #60 (is team #12 really better than team #13?) without the teams around those points having actually played each other directly to know for sure.
This uncertainty in math-derived rankings is an inherent problem with using such a system, which is why no established sports league in America uses them as the sole factor of playoff qualification or seeding. However, this doesn’t mean that this margin for error can’t be used to the advantage of an organizational body, if they understand what it is and how it can be used come tournament time.
Unfortunately, it seems that the WFTDA did not understand this when it came time to distribute tournament invites to its four Division 1 playoff sites. The resulting brackets may turn out to be a wholly unnecessary logistical and financial nightmare for many of the teams caught out by it.
To find out why, check back for the next WFTDA Bracketology installment, coming soon.