

With WFTDA rankings locked-in and the participating teams seeded into four cities across the United States, the first-ever WFTDA Division 1 playoff tournaments are set to kick-off this September.
As the growth of the modern game continues to seek a clear direction, the WFTDA is heading into new territory this postseason. Besides overhauling the ranking system to eliminate biases inherent in an opinion poll, the governing body has also made a significant change to its playoff format.
Out are the four distinct regional tournaments, which have been replaced by what is effectively one big championship playoff divided into four equally-seeded qualifiers. This method was selected by WFTDA member leagues to, according to them, allow for “more competitive play within and across” the whole of the playoffs, and ensure that “the best teams are eligible for Championships,” which this year will happen in Milwaukee the weekend of November 8.
In this installment of WFTDA Bracketology, it’s time to pick apart the Division 1 brackets and see how the WFTDA attempted to meet these and other goals, whether or not the methods it selected were the best way of meeting them, and if the concessions it made to do so were really in the best interests of its member leagues, and for roller derby as a whole.
In case you missed it, check out the first WFTDA Bracketology post wherein we discovered some issues with the Division 2 bracket and took observation at an alternate look at the Division 1 tournament, two things which will come in very handy for what you’re about to read here.
The 2013 WFTDA Division 1 Playoffs
The five events that make up the run for the Hydra championship trophy are no longer called “The Big 5” by the WFTDA, but the scale of the tournaments that now comprise the Division 1 playoffs are still pretty damn big. Forty teams are eligible regardless of what people are calling it these days, so let’s give “The Big 40” their due and see who is playing where this year.
Fort Wayne, Ind. – September 6-8
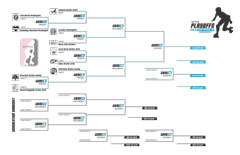
WFTDA Tournament Page
Official PDF Bracket
- Denver (2)
- Montreal (8)
- Arch Rival (11)
- London (16)
- Rose City (19)
- Ohio (24)
- Wasatch (27)
- Cincinnati (32)
- Bleeding Heartland (35)
- Grand Raggidy (40)
Richmond, Va. – September 13-15

WFTDA Tournament Page
Official PDF Bracket
- Angel City (5)
- Texas (6)
- Naptown (13)
- Philly (14)
- Kansas City (21)
- No Coast (22)
- Tampa Bay (29)
- Jacksonville (30)
- New Hampshire (37)
- Terminal City (38)
Asheville, N.C. – September 20-22

WFTDA Tournament Page
Official PDF Bracket
- Gotham (1)
- Rocky Mountain (9)
- Windy City (10)
- Minnesota (17)
- Steel City (18)
- Madison (25)
- Houston (26)
- Nashville (33)
- Oklahoma (34)
- Columbia (41)
Salem, Ore. – September 27-29

WFTDA Tournament Page
Official PDF Bracket
- Bay Area (4)
- Atlanta (7)
- Rat City (12)
- Detroit (15)
- Charm City (20)
- Boston (23)
- Sacred City (28)
- Victoria (31)
- Chicago Outfit (36)
- Toronto (39)
Again, the numbers in parenthesis indicate each team’s respective June 2013 WFTDA ranking which determined who got in and who went where in the playoff seeding.
Eagle-eyed readers will spot that Columbia, ranked #41 in the WFTDA, got into the tournament despite not being in the top 40. This is because—and this should not be a surprise to you unless you have been living under rock and key for the past few months—the current #3 ranked team, three-time finalist, and 2009 WFTDA Champion Oly Rollers did not meet playoff eligibility requirements. Their vacated spot created an opening at the bottom of the table, which the Quad Squad claimed.
The absence of Oly has been the subject of much discussion and a lot of speculation, some of it ridiculous and/or spiteful—and false, in both cases. The fact is that Oly made a team decision to not participate in any sanctioned WFTDA-rules games this year, except for the two they previously agreed upon in 2012. (London and Jet City, both Oly victories.) This, by extension, meant that they willingly chose to skip the 2013 WFTDA playoffs.
A major factor in their decision likely stems from the obvious friction between Oly and some (that’s some) in the roller derby community about how a handful of their players conduct themselves, despite playing by WFTDA rules on and off the track. It has also since come to light that Oly’s head NSO, Miss Nomer, was allegedly secretly investigated and legally threatened by the WFTDA for reasons related to her and other officials’ independent connection to USARS roller derby and its efforts.
And oh-by-the-way, the Oly Rollers have doubled-down on USARS play in 2013 after capturing the inaugural USARS championship last season.
Whatever the real reasons for Oly’s withdrawal from WFTDA play this year, the end result is that there is one fewer uber-powerful team in the WFTDA playoffs. Not having the 2009 champion playing in the 2013 championship tournament is a pretty significant mark against it. Not the least of which because there is now one less rock in the sling to try and have someone beat the Goliath that is the Gotham Girls of New York, the perennial Hydra favorite.
Despite Gotham coming in as the #1 ranked team in the WFTDA, however, the new bracket system will make their probable path to the final a somewhat tougher test this year. Playoff teams were segregated by region in previous years, which packed together many championships-deserving teams and created situations where they got knocked out of action before their time. It was not their lack ability that did them in, but the regional format’s lack of space for them in the WFTDA finals.
Teams have been equally distributed throughout the divisions and brackets this time around, as determined the an S-curve distribution we explained here last year. Once all 40 playoff teams were slotted into their spots, the four resulting brackets were assigned a playoff site by the WFTDA based on the best possible combination of reasonable driving distance and concentration of participating teams within proximity of each host city for each group of ten teams involved.
From a competition standpoint, the bracket-balancing act that the WFTDA is using will absolutely ensure that the best teams have a fair chance to play their way to the Championships without them having to worry about facing each too early on in the tournament. Taken in vacuum, this is a massive improvement over previous years.
However, the way the WFTDA went about doing this may have turned out to be an overreach. By insisting on a rigid seeding despite it being based off of an inexact and unproven ranking system, and despite having a player population that is made up almost exclusively of part-time amateur athletes of limited resources, the WFTDA may have lost a lot more than they gained with the new divisional format.
To see why requires an understanding of how an inexact and unproven ranking system can provide some much-needed flexibility in such a scenario.
The High Cost of Inflexibility
One of the WFTDA goals for the new league ranking and divisional playoff system, as stated in its white paper (PDF) on the matter, is this:
The best teams at Championships. Teams are seeded evenly across Playoffs based on rankings, removing equal representation from geographic Regions. This allows for more competitive play within and across the WFTDA Playoffs and ensures that the best teams are eligible for Championships.
A fair goal, and on the face of it, one that is hard to say has not been met in 2013. However, spreading out teams evenly across playoff sites is just part of the equation; where to put them after the brackets have been filled? The WFTDA thought of that, too, explaining where the preset brackets would land based on two criteria:
• If a hosting league qualifies for Playoffs, the bracket they are seeded into will be matched with their location.
• Absent a host league, WFTDA’s tournament team will look at the concentration of teams from a given area in close proximity to one of the Playoffs locations. Each bracket will be assessed for leagues’ driving proximity to each Playoffs location, and the bracket with the highest concentration of teams within proximity will be assigned to a given location.
The only team that hit the bracket jackpot and will play in their own tournament is Killamazoo, the league host of the Michigan-based Division 2 playoff site. For everyone else, it was a spin of the slot machine and a hope that they would land a playoff site that was nearby.
But with how chips fell and where teams ultimately landed in relation to their seeds and nearby playoff sites, there turned out to be a lot of teams, players, and fans disappointed with where they wound up, creating a “would have, could have, should have” situation for many.
The four Division 1 tournaments are mapped out below, with red pins on each map showing the teams travelling to each of the four playoff sites. The purple pins on all the maps are the four playoff sites, for reference. The darker purple line represents the teams with a travel distance that just-so-happens to match up with the one-way average of the other North American teams participating in their respective tournaments.

A breakdown of the travel involved for some of the teams to many of the tournament sites paints a rather alarming picture. Although the Asheville playoff site seems to have a reasonable set of itineraries for the 10 participating teams, things start to get less amicable as we go through the other locations.
Fort Wayne has a good cluster of five teams very close by, but this is contrasted by three domestic teams (four if you include London) that need to travel more than a thousand miles to start their playoff runs. Even worse: Rose City is less than 50 miles from the playoff site in Salem, yet is being forced to fly 3,800 miles to Indiana and back. To the Portland roller derby community, to see their team go so far away like that has got to be a major league bummer.
As we head further east to Virginia, the travel distances of those going there start to become a noticeable burden. Five teams at the Richmond site must travel around or at least 1,000 miles one-way; two, Angel City and Terminal City, tip the scales at plus-or-minus 2,300 miles one-way. The teams nearby and the teams far away cancel each other out in the average, which remains at the perilously high thousand-mile marker and pushes further away the “driving proximity” pipe dream.
And then we come to Salem, Ore.
Oh, Salem.
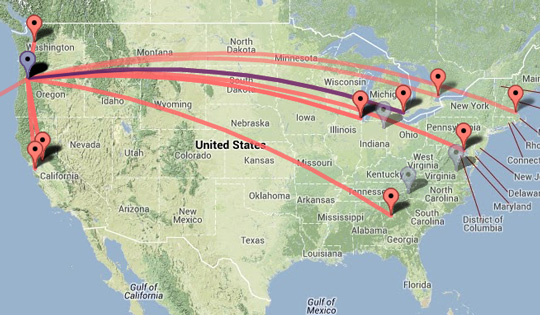
Look at this map. Look at it! Six teams are being made to fly across the country and pay for all the logistics involved in doing so, despite all of them being much closer to the other three playoff sites. At a soul-sapping 5,100-mile round trip, Boston has the furthest to go of all the playoff teams on the continent.
The average travel distance to Oregon (excluding VRDL’s 8,000 mile journey) of 1,573 miles, about the distance between Salem and Chicago, makes me wonder how so many skaters would be able to cope with such a big financial strain on their travel budgets.
Actually, some skaters have wondered the same thing. This was thought aloud by one of those very skaters potentially coming to Salem from Chicago back when the WFTDA originally announced its new playoff format last year:
Skater from a NC playoff team on 2013 frmt: "Getting headaches thinking about how on earth we'd swing an additional major trip financially."
— RollerDerbyNotes.com (@derbynotes) October 18, 2012
Why is this necessary? Why are so many part-time amateur athletes being asked to dump so much money into large travel expenses like this? Why do so many local fans, volunteers, and sponsors need to be separated from the teams they want to support in person? Why is it that some teams might have to make such a large round trip twice in the span of two months, should they qualify for Championships? (God save the London Rollergirls.) Shouldn’t a huge-large roller derby tournament trip be avoided unless it’s something a league has ample time to plan and raise funds for, or is an expense that is deemed absolutely necessary?
That last question is the key to this travel mess. Is it absolutely necessary that the WFTDA rankings be adhered to so strictly that it causes all of these burdens on this many leagues? Over one-third of Division 1 and Division 2 teams have trips of 1,000 miles or more to plan and pay for, pulling all of that money out of the derby economy and the coffers of leagues who may be better off using that dough to stage events closer to home.
Yes, this self-imposed travel nightmare was voted for and agreed upon by a majority of WFTDA teams. But did a majority of the 60 playoff teams want this? The number of teams in the playoffs is (and was, at the time of the playoff vote) a smaller number than the total majority in the WFTDA. Further, did a majority of the 20 Division 2 playoff teams agree to take on the potential extra travel expenses?
Even if a proper majority said that this was the way to go, the fact is that holding a tournament of this particular format and scale requires a potentially big financial commitment from all of the participating teams, not just a majority of them. So doesn’t it make sense to wait until 100% of leagues agree to this, rather than just the 51%?
Because it seems as if a lot of D1 and D2 teams have been suddenly taking to the Internet to ask for financial donations to help cover playoff travel costs. Like this one, for example. This one, too. And this one. And this one. And this one; also this one, with this one along with this one alongside this one in addition to this one, plus this one, not forgetting this one. And of course, this one. (And this one.)
The “please give us free money so we can participate in the playoffs” model, even if a majority voted on it, is probably not something that’s realistically sustainable in the long run. Surely, there must be a better way of meeting the WFTDA’s goal of an evenly-seeded playoff tournament without putting so much financial pressure on so many leagues.
There is, actually. It is totally possible to get the competitive benefits of equally distributed brackets without sacrificing regionally-accessible tournaments, setting up a best-of-both-worlds scenario where far more teams—and their fans and sponsors—don’t have to be taxed to help fund their leagues and then be told they can’t personally represent them in their most important games of the year.
As it turns out, the WFTDA has already figured out how to do this. It just appears as if it hasn’t quite realized it yet. Or more likely, is as of yet incapable of making the concessions necessary to be flexible enough to implement it.
In the same news announcement where the WFTDA explained who plays where, there were listed two “exceptional circumstances,” the only scenarios under which the perfectly equal, totally inelastic, we-have-to-do-this-to-meet-our-goal S-curve seeding distribution would be deviated from:
• Multiple host leagues seeding into the same bracket: If two Playoff hosts are seeded into the same bracket, the lower-seeded team will swap places with another team seeded into the same bracket spot. For example, teams ranked 9 to 12 are all seeded into the #3 spot in their respective brackets. The team that would gain the most geographic advantage is given preference for the swap.
• At the discretion of WFTDA Games Oversight, an exception can be made for league with a demonstrated, exceptionally large and dedicated fan base in close proximity to one of the Playoff locations.
Luckily, no bracket found itself in double jeopardy. But more to the point, the WFTDA deemed that no league showed a “demonstrated, exceptionally large and dedicated fan base in close proximity” to a site to see the need to move them out of their preordained bracket, since all four brackets follow the S-curve exactly.
This makes sense once you realize that teams like Detroit (travelling 1,990mi to Salem instead of 163mi to Ft. Wayne), Chicago Outfit (1,780mi to Salem vs. not 130mi to Waynetown), and Rose City (1,900mi to Indiana rather than 50 miles down the road) don’t have large or dedicated fan bases.
What’s that, derby fans of Detroit, Chicago, and Portland? You say you are large and dedicated? Don’t be silly. The WFTDA clearly decided that you are not. It would have made an exception for you if you were! Suck it up whiners, this is a democracy.
So yeah, there have been some questionable decisions and non-decisions made as to why no concessions were made for at least these teams, especially when so many others had to give up a cheap hours-long drive for an expensive hours-long flight.
And for what?
The one and only possible justification that the WFTDA has in doing it this way is that its new ranking system is so good at determining the true strength of ranked teams, one of them would be unfairly advantaged or disadvantaged if it played against an opponent that was one or two ranking spots above or below the regular S-curve assignment.
The WFTDA apparently feels that it is crucially important for bouts set by the actual S-curve, like #16 vs. #19 and #15 vs. #20 to happen; rather than bouts that slightly deviate from it, like #16 vs. #20 and #15 vs.#19. This is despite the fact that the latter match-ups would save several thousand miles and (crucially important) dollars worth of travel costs and allow the local fans of the #19 and #20 ranked teams (Rose and Charm) a much more realistic opportunity to see their teams up close (in Salem and Ft. Wayne, respectively).
This comes back to the proposed deviations that would have been made to the S-curve. Funnily enough, the WFTDA explanation of its “exceptional” exceptions is exactly what proves that they are anything but.
The Pros (and no Cons) of Flexible S-Curve Seeding
Taking the WFTDA example, here are the four teams ranked 9-12 (10-13, adjusting for Oly’s absence), which eventually became the 3-seeds in the four Division 1 brackets. Look at how many ranking points they have in comparison with their neighbors:
309.93 – Windy City (10)
307.67 – Arch Rival (11)
305.82 – Rat City (12)
301.80 – Naptown (13)
There isn’t much of a gap between these four teams, is there? Two points here, two points there, four points over yonder. That’s less than a 1% difference compared to how many ranking points they have. The same case can be made among the teams ranked in the 21-24 (22-25) zone, the 6-seeds which will be playing against the 3-seeds listed above:
267.49 – No Coast (22)
265.49 – Boston (23)
263.94 – Ohio (24)
262.50 – Madison (25)

The closeness of the rankings among any four teams within a tight group, such as these two, suggest that they are roughly of equal rank. Okay, Boston is 1.55 ranking points higher than Ohio. But what does that even mean? If the two played each other on the track, their rankings would suggest their match-up would be very close. But that’s irrelevant here, since they will be in different brackets altogether.
However, if either of the two played Windy City, the difference in their rank strength would suggest a Windy City win either way. In fact, Windy City would (in all probability) beat any one of the four teams in the second group quite easily, regardless of their exact ranking points difference. So why is it that the team they wind up first facing in the playoffs absolutely must be the Mad Rollin’ Dolls of Madison?
The differences among a group of four teams in proximity is, for the most part, negligible. This difference becomes even more irrelevant as the high-low gap between ranking groups grows. Actually, this gap will always show up in tournament seeding, because seeding is designed to spread out the ranking of teams so that they start far apart and end up closer together.
We can take advantage of this to create some “wiggle room” within each group of the rankings table and make harmless adjustments to the S-curve, where possible, when it is advantageous to do so. In other words, we can have “competitive play within and across the WFTDA playoffs” without completely sacrificing “equal representation from geographic regions.” This is one of the rare cases where the WFTDA can, for the most part, have it both ways.
This is a task that can be achieved by changing the priority order in which the playoff brackets are populated. For the 2013 tournament, the WFTDA appeared to break things down in the following order:
- Calculate team rankings
- Simultaneously fill all brackets based on rankings, using a rigid S-curve distribution
- Assign seeds to teams based on positions with each bracket
- Assign brackets to playoff sites based on best geographical proximity of participating teams
This method assumes that step #2, the preservation of ranking order, is more important than where teams ultimately wind up. But we have already determined that is a misplaced priority. A difference of 0.09 ranking points is a statistical tie, yet Atlanta (#7; RP: 324.68) was made to travel an extreme distance across the country while Texas (#6, RP: 324.77) got a relatively average travel distance.
Both of these teams, effectively of equal rank, could have had an easier trip. All the WFTDA had to do was instead populate the playoff brackets in this order:
- Calculate team rankings
- Assign seeds to teams based on rankings, using a flexible S-curve distribution
- Assign playoff sites to teams based on geographical proximity of equally-seeded teams
- Independently fill brackets based on seeds
For example, if we figure that Texas (6), Atlanta, (7) Montreal (8), and Rocky Mountain (9), are all of roughly the same strength when compared to Houston (26), Wasatch (27), Sacred City (28), and Tampa Bay (29), we can generally ignore the precise ranking of each team and just assign them an equal bracket seed. This means any potential bout combination of 2-seed (rank 6-9) vs 7-seed (rank 26-29) will probably end the same way regardless of the precise rank vs. rank setup: The 2-seed will win the vast majority of the time.
Knowing this, we can forget about sending #7-ranked Atlanta to Oregon and #9-ranked Rocky Mountain to North Carolina because of how the other brackets were locked-in. Instead, we can send 2-seed Atlanta to Virginia and 2-seed Rocky Mountain to Oregon, since it is far more geographically advantageous and negligibly competitively disadvantageous to do so.
This is how the S-curve becomes “flexible.” By broadening the curve to four-team ranking chunks, a multitude of placement options open up when it comes time to determine which one of the four X-seeds, regardless of ranking, goes to which playoff site.
Expanding this methodology to the whole Division 1 tournament field, giving placement priority to higher-ranked teams within the same seed group and avoiding unbalanced or unreasonable travel distances wherever possible, eventually creates four brackets at four tournament sites that might, in one example, look something like this:
Division 1 Playoffs Example with Flexible S-Curve Seeding
Fort Wayne, Ind.                  Richmond, Va.
 1. Angel City (5)                 1. Gotham (1)
 2. Montreal (8)                   2. Atlanta (7)
 3. Windy City (10)                3. Naptown (13)
 4. Detroit (15)                   4. London (16)
 5. Kansas City (21)               5. Steel City (18)
 6. No Coast (22)                  6. Boston (23)
 7. Wasatch (27)                   7. Tampa Bay (29)
 8. Cincinatti (32)                8. Jacksonville (30)
 9. Chicago Outfit (36)            9. New Hampshire (37)
10. Grand Raggidy (40)            10. Toronto (39)

Asheville, NC                     Salem, Ore.
 1. Denver (2)                      1. Bay Area (4)
 2. Texas (6)                       2. Rocky Mountain (9)
 3. Arch Rival (11)                 3. Rat City (12)
 4. Philly (14)                     4. Minnesota (17)
 5. Charm City (20)                 5. Rose City (19)
 6. Ohio (24)                       6. Madison (25)
 7. Houston (26)                    7. Sacred City (28)
 8. Nashville (33)                  8. Victoria (31)
 9. Bleeding Heartland (35)         9. Oklahoma City (34)
10. Columbia (41)                  10. Terminal City (38)
.
This distribution of teams does several things, all of them beneficial. The first and most obvious is the massive amount of travel savings enjoyed overall. By trying to hold down high travel costs where possible instead of just dealing with the consequences of slotting in exact ranked-based brackets, the average distance for many, many more teams to reach their playoff site comes down to comfortably reasonable levels.

(The comparison is even more pronounced when you compare the two maps directly in this animated GIF comparison of the two seeding distributions.)
Under the WFTDA rigid S-curve placement model, the total one-way distance traveled for the 38 North American teams to reach their playoff sites is 36,726 miles, an average of 966 miles per team. Under a flexible S-curve model, of which one way of following is shown above, the mileage total is 22,578, or 594 mi. per team. This is nearly a 40% reduction in travel, or more than 14,000 miles—which, coincidentally, happens to be the total distance (14,587 mi.) the 20 Division 2 playoff teams need to cover to get to their two playoff sites.
Basically, WFTDA leagues are potentially wasting so much on travel in Division 1 this year, they could have cashed in their frequent flyer miles to get two divisions’ worth of travel for the price of one.
Another benefit is that it preserves a “regional” tournament feel at each of the four playoff sites. Better than a regional, actually, since it gives local fans both a nice mix of familiar teams in their region to root for/against, plus a few extra teams coming in from other regions that they would not normally get to see in person.
Westerns would become even more Besterns with most of the area teams also playing versus Minneosta and Madison, for example. This is in contrast to how “westerns” are now, with six teams coming in from far from the east coast and two not attending from the immediate area—or in some cases, the very immediate area.
But all this talk about cutting down on travel expenses and preserving the regional flavor of the brackets is secondary to the reasons why these principals were abandoned in the first place. The WFTDA wanted to make sure all of the teams involved would have a fair shot at getting to Championships and that all tournaments would be equally competitive from top to bottom.
So the big question remains: Does flexible S-curve seeding, with all its advantages, still meet the same goal as rigid S-curve seeding the WFTDA decided was the best path to take?
Below are two lists. The one on the left shows the teams predicted to make it to the WFTDA Championships this year, using the Flat Track Stats predictor tool (as calculated the week of July 15) to determine who will probably make it to Milwaukee under the rigid S-curve. The one on the right lists the teams who will probably to make it to Champs under the flexible distribution.
Take careful note that the initial seeding distribution of teams under the flexible model proposed above only preserves 14 of 40 teams that were initially distributed rigidly, making the starting brackets very dissimilar from each other.
But as for the ultimate result? Check this out:
Probable WFTDA Championship Participants
Rigid (Current WFTDA)            Flexible
 Gotham (1)                       Gotham (1)
 Denver (2)                       Denver (2)
 Bay Area (4)                     Bay Area (4)
 Angel City (5)                   Angel City (5)
 Texas (6)                        Texas (6)
 Atlanta (7)                      Atlanta (7)
 Montreal (8)                     Montreal (8)
 Rocky (9)/Windy (10)*            Rocky Mountain (9)
 Rat City (12)                    Windy City (10)
 Philly (14)                      Philly (14)/Ohio (24)*
 London (16)                      London (16)
 Minnesota (17)                   Minnesota (17)/Rose (19)*
.
The three asterisks indicate a third-place game or sooner where the FTS numbers indicate that either of the two listed teams could probably win, effectively giving each of them a 50/50 chance of making it in. The three italicized teams out of the combined 27 listed here are the only teams that don’t show up in both lists. But more importantly, these differences do not affect 10 of the 12 probable championship contenders—also known as some of the best teams in the WFTDA.
Expanding upon this even further, the 16 divisional semifinal bracket slots give the teams populating them two chances to make it to Championships, by either winning and advancing to the divisional final; or losing but eventually winning in the third-place game. If there was really difference between the two models, there would be a noticeable disparity between the 16 teams who got there via rigid assignment and the 16 teams who earned that double-chance with the benefit of flexibility.
But again, the difference isn’t really there. Of the 35 combined teams that make up those bracket spots (again adding in a few extra teams for games that are too close to call) there are only four total deviations similar to those above. More importantly, at this stage all 10 of the top-ranked teams and 13 in total have their probable chances completely unaffected by the change in format. This still suggests, and very strongly at that, that “the best” teams in the WFTDA are still getting assurance that they would have a fair shot at playing for the Hydra, regardless of how the brackets were initially built.
Therefore, we can only come to one conclusion: A flexible S-curve seeding distribution can not only achieve the same goal as a rigid S-curve, but it can do it with significant travel cost savings and allow more fans, volunteers, and sponsors support their teams closer to home.
– – – – – – – – –
The WFTDA did not come to the same conclusion.
The assurance of fair and equal seeding was the entire reason why its member leagues voted it necessary to completely dump the regional aspect of its playoff tournaments. However, it is extremely difficult, and probably impossible, to argue that the small theoretical benefits gained with remaining true to the exact rankings are worth taking over the very large and very real benefits of reduced travel/travel expenses and higher local fan/sponsor participation at each of the playoff sites that flexible S-curve seeding provides, when the same ultimate goal can be achieved either way.

When the WFTDA revealed the tournament brackets a few weeks ago, they noted that the S-curve seeding model it used to make the brackets was “similar to what is used for the NCAA basketball tournaments,” as if that were a justification for their methodology. Unfortunately, what the WFTDA is saying is not matching up with what it is actually doing, as the way the WFTDA did its tournament seeding is not at all similar to how the NCAA does it for its tournament.
The chart to the right lists the teams that qualified for the 2013 Men’s Division 1 Basketball National Championship tournament, or March Madness. The specifics behind the calculation of the NCAA ranking system, Ratings Percentage Index (RPI), is not of concern to this comparison. What is, is the distribution of tournament seeds. Look over the chart and notice there is no absolute connection between team rating and assigned seed. But there is a general connection, in that the higher the team rating , the higher its assigned seed will generally be. But not exactly.
While the NCAA ultimately starts with a giant list of teams ranked 1-64 (or 1-68), the calculated order of these ranked teams is never the exact order they are distributed throughout the brackets. This is because the NCAA must weigh other factors, particularly the geographical proximity to playoff sites for higher-ranked teams or smaller schools. Although distinctions can be made between a “stronger” 3-seed and a “weaker” 3-seed, there is still wiggle-room to shuffle the distribution to where it is optimal for all parties involved, without disrupting the overall equality of the brackets.
That is to say, the flush-wish-cash NCAA has no problem being flexible with seeding and being reasonable where they can be. For them, it is standard practice, because it only makes sense to do it that way.
With the DIY, donation-dependent WFTDA, flexible seeding is an “exceptional circumstance.” But for the body, it is standard practice to ask so many part-time athletes, fans, volunteers, and sponsors to pull even more money out of their pockets, when it turns out that money could be being spent unwisely—because that is what the member leagues voted for.
Which is why it’s troubling that the same member leagues that voted to unnecessarily spend on playoffs travel will be asking for further donations to assist with the WFTDA.tv Division 2 webcasts.
Even if the current playoff format works out to be a success on the track, which all indications say it will probably be, what the WFTDA had to sacrifice to get there could be interpreted as a clear mistake. Or at least, very poor judgement. And even its member leagues come around next year and choose to be more flexible with placement of teams into playoff locations, that’s not going to be of any help to the member leagues that are apparently scrambling for additional funds this year.
Moving forward, the WFTDA will need to learn to be flexible enough to help ensure everyone can keep pace with—and pay for—the growth of the game, not just the majority of it. Let’s hope the WFTDA will realize this soon enough to avoid it potentially costing everyone more than it has to.